A variety of studies have found this ‘performance order’ bias in everything from the Idol series, Eurovision and figure skating and music competitions. This bias isn’t inconsequential either, in events where careers can rest on the outcome performance order bias can have a significant impacts.
So what about Lindy Hop competitions? Does the order of appearance matter?
 |
| Judging – an unenviable task (photo by Jerry Almonte) |
In the spirit of my previous post on electoral methods I’ve delved into the data so you don’t have to. My source: results from the 2013 and 2011 European Swing Dance Championships (most of the other major contests I’ve looked at don’t provide the performance order with the official results – if anyone has the data and wants to send it to me to include in the analysis I’d be happy to expand it). This provides a dataset of 30 contests with between 4 and 15 individuals, couples or groups in each contest.
For analysis I’ve converted all the placings into standardised scores to enable comparison between contests of varying lengths.
Here’s what the data looks like:
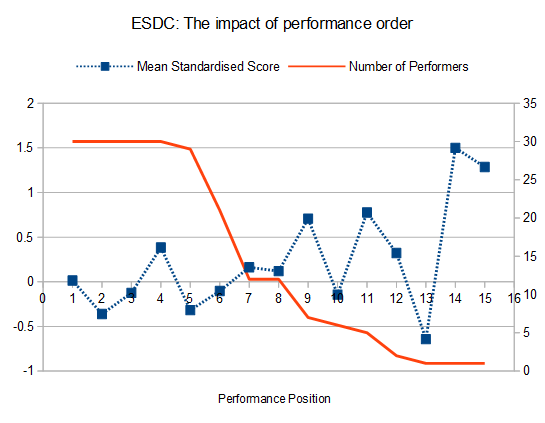
You can see that the number of competitors in gets rather smaller for the larger events, but you can visually see a slight rising trend even when you discount the results in larger divisions.
To test whether this was just a statistical quirk I set up a multi-linear regression model with an order variable and two additional variables to see if there were any effect of appearing first or last in addition to to the performance order effect.
Here’s the model statistics:
| Estimate | Standard Error | T Statistic | Pr(>|t|) | |
| (Intercept) | -0.35908 | 0.15729 | -2.283 | 0.0234 |
| First | 0.29989 | 0.22564 | 1.329 | 0.1852 |
| Last | 0.08663 | 0.21062 | 0.411 | 0.6813 |
| Order | 0.06666 | 0.02848 | 2.34 | 0.0202 |
These data show that there appears to be a small performance order bias in these results – but though it’s at the level of significance that could get you published in certain social science journals I’d be hesitant to say that it exists for sure.
On the other hand, beyond the performance order bias there appears to be nothing special about appearing first or last.
Converting out of standardised scores let’s look at what these results could mean in an actual contest or let’s say 12 people. If the differences between everyone’s score is similar (which is not really realistic, unless there’s a tight contest) – this effect could mean the difference two places if you appeared first instead of last.
| From xkcd – full comic here |
What could be going on here? Firstly it could very well be nothing. The order bias is only just within the normal 95% p value – which is not nearly as impressive as you might think. More data could cause the effect to disappear.
EDIT: But, not so fast, remember how there were only a handful of divisions with large numbers in them? There was only a single division with 15 competitors and only a single one with 12. What happens if we repeat the analysis with them removed? (and thanks to one of my FB friends for suggesting this analysis) Here’s the results:
| Max size | Estimate | Standard Error | T Statistic | Pr(>|t|) |
| 15 | 0.06666 | 0.02848 | 2.34 | 0.0202 |
| 12 | 0.085237 | 0.034704 | 2.456 | 0.0149 |
| 11 | 0.07006 | 0.03885 | 1.803 | 0.0729 |
| 10 | 0.06518 | 0.05556 | 1.173 | 0.243 |
| 9 | 0.08808 | 0.06351 | 1.387 | 0.168 |
| 8 | 0.06139 | 0.07081 | 0.867 | 0.388 |
| 6 | 0.005641 | 0.124636 | 0.045 | 0.964 |
| 5 | 0.333 | 0.2568 | 1.297 | 0.202 |
Remove the two largest divisions and the order bias effect quickly disappears. So we can be reasonably confident that there is no performance order bias for competitions smaller than 10 or so entrants. For larger divisions we’ve really only got two contests to go off – this is really not enough data to be able to say one way or the other.
It’s reasonable that if judges are affected by a recency bias then this may only appear in larger contests. But there are also other explanations besides a recency bias on the part of the judges. Audience reaction could change throughout an individual contest and this could subtly bias the evaluations of the judges.
So how could we find out if there is an order bias? More data on the largest divisions could help but the ultimate would be a controlled experiment. Judges would watch performances on video and in different orders for each group of judges. You could also implement this in actual competitions which would effectively control for any performance order bias present, but such a radical change to judging practices is unlikely to catch on.
If you’re a competition organiser and you don’t randomise the performance order of your competitors, you really should. If an order bias does exist then it’s easily something that could build up over time and give some people (for example with names at the end of the alphabet) an edge in landing that all elusive international teaching gig. Releasing judge scores may also help – some research suggests that increased transparency, the idea of someone looking over your shoulder, can help reduce unconscious biases.
Sadly the major international lindy competitions aren’t consistent in this practice, both ILHC and ESDC have posted individual judges scores previously but not for every year (and the ILHC results do not contain performance order – and appear to have been taken down), the National Jitterbug Championships, the US Open, the American Lindy Hop Championships, the Canadian Swing Dance Championships, The Snowball and Lindy Shock do not.
 |
| I’m not talking about that sort of bias |
There are potentially a range of other biases that could be relevant to Lindy Hop competitions such as reference bias (where a judge gives a higher score to a person they are familiar with – though it’s unlikely to occur at the highest levels where the competitors are all familiar to the judges), difficulty bias (where more difficult routines are scored higher, even if difficulty is scored separately), in-group bias (a close relative of reference bias – where a person is judged more favourably because they share the same dance school/city/country/race etc. with the judge), the halo effect (where one element of a persons character, such as attractiveness, influences assessments of other elements of their character), memory-influenced bias (where past performance influences current assessments) and groupthink (where a group of judges reaches a false consensus – this isn’t a problem when each judge scores independently, which appears to be the practice for most international comps).
Finally I want to emphasise that I’m not suggesting that judges are behaving unprofessionally. The problem with cognitive biases is that we all have them, they can’t be switched off and thus require a lot of cognitive energy to overcome. Awareness and acknowledgement of potential bias can go a fair way to moderating their influence.
For further reading check out this article “Natural Bias, the Hidden Controversy in Judging Sports” or if you’re interested in cognitive biases and the psychology of decision making grab a copy of Daniel Kahneman’s “Thinking Fast and Slow”.
If you’ve read this far congratulations! Have a picture of an echidna:

gregbo
May 19, 2014 at 17:20This issue was mentioned by Barry Durand in a rec.arts.dance thread 15 years ago. I think it was discussed in other rec.arts.dance threads, but don't remember which ones offhand. If I find them, I will post links to them.<br /><br />https://groups.google.com/forum/#!topic/rec.arts.dance/YrXeAvZmcqw/discussion